
SEO Traffic Drop Diagnosis: An 8-Step Process, 7 Keyword Patterns, and How to Grade Causes
- RedClaw Performance Team
- RedClaw Performance Team
- Date
- Reading time
- 11 min read
TL;DR: When organic traffic falls, the first job is to verify, not to fix. We run the same eight steps every time: size the drop, scope it, check the baseline, split by hostname, rule out technical failure, check indexing, split by search engine, then write the conclusion. Two traps account for most wasted effort. One is a bad baseline: a 10,000-plus-page video site we took over showed -27.9% week over week, and eight weeks of daily data showed the prior week had simply been the best in ten. The other is unsplit GA4↗: a network total of -20% turned out to hide a main domain that was up 57.5%. Keyword movement falls into seven patterns that point you in a direction, and every cause in the write-up gets one of four evidence grades. "Algorithm fluctuation" is not a cause.

The rule: work back from the data, never forward from a hunch
Traffic fell, so what do you check first? Nothing yet: a traffic drop diagnosis works back from the data: check what changed, how wide it is, which pages and queries, and how those pages look now, then judge.
The most expensive mistake in a traffic drop is deciding what happened before you look. Someone sees the line bend down, says "we got hit by an update," and the team starts rewriting titles, deleting posts and reshuffling internal links. By the time the real cause turns up, the site has changed under everyone's feet and the before-and-after data is muddied beyond use.
So the order is fixed: what changed in the data, how wide the change is, which pages, which queries, what those pages look like right now, and only then a judgement. You don't skip ahead. Google's own guide to debugging search traffic drops↗ follows the same logic: look at the shape and scope of the drop first, then talk about causes.
Two principles travel with that order. First, read absolute numbers, not only percentages. Search result pages falling 50% might cost you 500 clicks. Article pages falling 10% might cost you 20,000. A report that only shows percentages pulls attention to the scariest number, which is often not the one that matters.
Second, the live site is the source of truth. Status codes, robots directives, canonicals and sitemaps get checked with curl against production. Search Console, Bing Webmaster Tools and Yandex Webmaster all lag by days or weeks, so they tell you what was true, not what is true. Diagnosing the present from a delayed report is how people chase problems that were fixed last Tuesday.
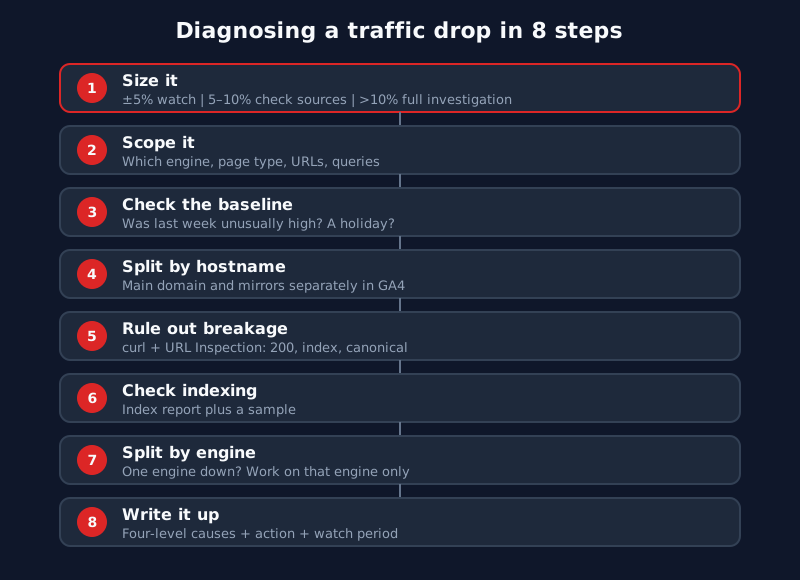
Eight steps, in this order
The traffic drop diagnosis runs eight steps in a fixed order: size it, scope it, check the baseline, split by hostname, rule out technical failure, check indexing, split by engine, write it up.
We arrived at this sequence by running it, getting it wrong, and adjusting across several large content sites:
| # | Step | Question | Output |
|---|---|---|---|
| 1 | Size it | How big is the drop, and is it worth acting on? | Within ±5%: watch. 5–10%: check sources and the pages that fell. Over 10%: open a dedicated investigation. Three to seven straight days of decline gets a look even if each day is small |
| 2 | Scope it | Which engine, page type, URLs, queries? | Which of clicks, impressions, position or CTR actually moved |
| 3 | Check the baseline | Was the comparison period normal? | Whether the prior period ran unusually high, or included a holiday |
| 4 | Split by hostname | How are the main domain and mirrors each doing? | GA4 broken out by hostname |
| 5 | Rule out technical failure | Can the site be crawled properly right now? | Homepage and worst-hit pages: 200, index, self-referencing canonical, crawlable |
| 6 | Check indexing | Are the pages still in the index? | Page indexing report (indexed, not indexed, reasons) plus URL Inspection samples |
| 7 | Split by engine | Did every engine drop, or just one? | If one, a project scoped to that engine only |
| 8 | Write it up | What caused it, how strong is the evidence, what next? | Graded causes, a plan, and an observation window |
The order is about cost. Steps 3 and 4 take minutes: change the date range, add a dimension. They also kill a large share of "traffic drops" outright. Steps 5 and 6 mean page-by-page checking and take far longer. Teams that jump straight to indexing often spend an afternoon there before noticing nothing was really falling.
One note on step 5. Check the pages that fell the most, not just the homepage. The homepage is usually the best-maintained URL on the site. It being fine says little about the templates underneath. Be specific about what you check: 200 status, index directive, a canonical pointing to itself, and crawlability. Whichever one fails is probably your answer. If you need a reference for how each page type on a big site should be configured, our piece on large-site indexing and sitemaps has the page-type rules.
The baseline trap: sometimes last week was just too good
A traffic drop can be a baseline artefact: a 10,000-page video site showed -27.9% week over week, but eight weeks of daily data showed the comparison week was the best in ten.
This is the one we hit most often. A 10,000-plus-page video site we took over showed traffic down 27.9% versus the previous week in October 2026. That clears the 10% bar for a full investigation, and it looked serious.
Pulling eight weeks of daily data told a different story. The comparison week, September 27 to October 3, was the strongest week in the last ten. The "drop" was mostly the baseline being unusually high. Long public holidays, such as a national holiday week, inflate baselines the same way, so be careful whenever a comparison period sits on or next to one. Had we acted on the weekly number, every change that followed would have been a fix for a problem that didn't exist.
The routine for step 3 is simple. Don't compare against one week. Pull at least eight weeks of daily data and see where the current week actually sits on the curve. Then check the calendar for holidays, campaigns or news events in the comparison window. Week-over-week numbers are good alarms and poor conclusions.
The hostname trap works the same way. On another content site, GA4 showed the whole network down 20%. Split by hostname, the main domain was up 57.5%. The decline was all on mirror domains. In a separate case, Google traffic shifted from the main domain to a CDN direct-access domain, whose sessions went from 708 to 1,693, which made the main domain look like it was sliding. In neither case was anything broken. The traffic had just moved to a different address.
The hostname split uses a standard GA4 dimension. The GA4 dimensions and metrics reference↗ lists what each one means. A useful cross-check: if GA4 is down but Search Console clicks are flat, stop thinking about SEO↗ and look at tagging, attribution settings and redirects first. The two tools aren't measuring the same thing at that point.
Seven keyword patterns, and where each one points
Keyword movement falls into seven patterns, such as impressions down with position steady or many queries falling at once, and each pattern points to a different place to investigate first.
Once the drop is scoped, you need a direction. We sort keyword movement into seven patterns:
| # | What you see | Where to look first |
|---|---|---|
| 1 | Impressions down, position steady | Demand fell. Fewer people are searching. Not your page |
| 2 | Impressions and position both down | Page competitiveness, or indexing |
| 3 | Impressions steady, CTR down | Title and description, or the results page layout changed |
| 4 | Position and impressions steady, clicks down | CTR by country and device, and whether a different URL is now ranking |
| 5 | A handful of core queries down | Cannibalisation, or another page took the slot |
| 6 | Many queries down at once | Templates, canonicals, internal links, indexing. Find the shared factor; don't fix query by query |
| 7 | Going up | Write down the conditions so you can repeat them |
Pattern 1 gets misread more than any other. Your position hasn't moved. There's just less search volume for the term. Editing the page won't help because the page isn't the cause. The useful work is figuring out whether the demand dip is seasonal, tied to an event, or a long-term trend, and deciding whether to move effort elsewhere.
Pattern 6 needs the most restraint. When hundreds of queries fall together, the instinct is to open them one by one. But synchronised drops almost always share a cause: a template change, canonicals set wrong in bulk, an internal linking change, or a batch of pages falling out of the index. Fixing queries individually won't work and tends to bury the real cause. Map the falling queries back to their pages and look for what those pages have in common.
Pattern 7 is easy to skip because nobody investigates good news. But if you can't say why something went up, you can't do it again. We ask for the same write-up on gains: which page types, which queries, what changed, and whether the timing lines up.
Five things that look like problems but aren't
Five common traffic alarms are false: each is an artefact of how something was measured, such as a rotated audit sample or a network total that mixes several domains.
These come from real monitoring work. Each one caused some alarm before it was checked:
| What you see | What's actually going on |
|---|---|
| The audit reports "50 new issues" | The sample rotated to a different set of pages; the total is flat |
| Google doesn't know a new article yet | Normal within one to two days. Watch older articles instead |
| Video stream URLs (m3u8) return 400 when requested directly | The video CDN re-signs URLs on every render; non-browser clients get 400 by design |
| One engine reports 5xx errors | Other engines are crawling fine, so the problem sits with that engine's crawler (in our case, Bing) |
| GA4 shows the network declining | Split out the main domain and it may be growing |
All five are artefacts of how something was measured, not changes to the site. Rotate the sample and the issue count jumps. Curl a URL that needs a signature and of course it fails. Add several domains together and the direction can flip. Asking "how did I get this number?" before anything else saves whole rounds of investigation.
Be especially careful with sampling. A dozen URL Inspection checks can surface a problem, but they can't support a sitewide conclusion. Any statement about index coverage needs the full indexing report behind it. For large page types like tags, our tag page audit goes further, including why core tags that are still indexed point to a ranking problem rather than removal.
If only one engine is affected, only work on that engine
When only one search engine is affected, run a project for that engine alone and leave sitewide settings untouched, because changes meant for one engine also hit the others.
Step 7 rests on a principle: if only one search engine is misbehaving, run a project for that engine and leave sitewide settings alone. Two of our cases went this way. In one, Bing kept reporting 5xx errors while Google and the other engines crawled normally. In the other, a content site saw organic traffic fall 38%, and 85% of that site's organic traffic comes from Yandex.
The second case, in October 2026, went like this. We checked whether Yandex's count of searchable pages had dropped. It hadn't, which ruled out mass removal from the index. What remained was a cooling of interest in person-name queries, and since that rested only on correlation, it was graded as unverified. No sitewide setting was changed at any point.
Why not change the whole site for one engine? Large sites usually get traffic from several engines at once. Change robots rules or canonicals to fix Bing's crawling and Google and Yandex feel it too. You can fix one and break two. The engines also don't follow identical rules. Bing has its own webmaster guidelines↗, and Yandex handles robots meta tags↗ differently from Google. When you genuinely need a Google-only change, the googlebot-specific tag in Google's robots meta specification↗ leaves other engines untouched. Our large-site content pruning guide shows that approach in practice.
Writing the conclusion: four evidence grades, and "no change" as a real plan
A traffic drop conclusion grades every cause as confirmed, likely, unverified or ruled out, and "no change" counts as a real plan only if it states why, what to watch, for how long and what triggers action.
In step 8, every cause gets a grade:
| Grade | Meaning |
|---|---|
| Confirmed | Backed by technical, data or on-page evidence |
| Likely | Several independent signals agree |
| Unverified | Correlation only |
| Ruled out | Checked and eliminated |
"Ruled out" is the grade people drop, and it's the most useful one. Writing "ruled out index removal: Yandex searchable page count did not fall" means the next person doesn't re-check it. It also shows readers you closed off possibilities instead of listing whatever came to mind.
Some phrases are banned from the conclusion outright: "algorithm fluctuation," "insufficient content depth." Those things can be real, but a sentence that carries no evidence can't be tested or disproved. If you suspect quality, say what you compared and what difference you found, and grade it accordingly.
Then the plan. "No change for now" is a legitimate outcome. A baseline artefact or a pattern 1 demand dip often calls for exactly that. But it has to answer four questions: why you aren't changing anything, which metrics you'll watch, for how long, and what would trigger action. Without those, "no change" just means nobody wanted to deal with it.
Here is the Yandex case dropped into that format. The observation length and trigger are placeholders. Set your own:
Observation: organic traffic -38% (with source and pull date)
Scope: 85% of this site's organic traffic comes from Yandex
Ruled out: mass removal from the index (Yandex searchable pages did not fall)
Unverified: lower interest in person-name queries (correlation only)
Plan: no sitewide changes; Yandex-specific work only
Watch: Yandex searchable pages and core query impressions; state the number of days,
       and a trigger such as "escalate if searchable pages start falling"
None of this needs special tools. Search Console, GA4 and curl cover it. The hard part is following the order every time instead of jumping to a conclusion at step two. If you'd like someone to watch your numbers week to week and work through these eight steps whenever traffic slips, that's part of what our SEO site build and management service does.
This is one chapter of our large-site SEO guide, which maps all six workstreams and the order to tackle them in your first week.
FAQ
How big does a drop need to be before I act?
Within ±5%, watch it. Between 5% and 10%, check where traffic comes from and which pages fell most. Above 10%, open a dedicated investigation. Three to seven consecutive days of decline deserve a look even when each day is small, because slow slides are easier to miss than sudden ones.
Search Console and GA4 disagree. Which one do I trust?
Neither, yet. GA4 falling while Search Console clicks hold steady usually points to tagging, attribution or redirects. Then check that GA4 is split by hostname, since network totals and the main domain often move in opposite directions. Get the two aligned before deciding whether SEO is the problem.
Why isn't a week-over-week comparison enough?
Because the previous week may not have been normal. We saw a -27.9% week that, over eight weeks of daily data, turned out to be mostly a comparison against the best week in ten. Holidays inflate baselines too. Use week-over-week as an alarm and judge it against a longer curve.
Only Bing or Yandex dropped. Should I change the site structure?
No. Scope the work to that engine. Changing robots rules or canonicals affects every engine at once, and you risk fixing one while breaking another.
Can I cite an algorithm update as the cause?
You can mention one, but only with evidence and a grade. If the only link is timing, it's unverified. "Algorithm fluctuation" with nothing behind it doesn't belong in a conclusion.
Related Posts
- strategyAI Content Quality Checklist for Bulk Publishing: 12 Pre-Publish Checks and a Front-End AuditAI publishing errors at scale are template errors: one bug ships in a dozen posts. Our 12 pre-publish checks, a front-end audit, and why auto-fixes need a lint.
- strategyContent Pruning for Large Sites: A/B/C Tiers, Red Lines and Hard Evidence for MergesContent pruning on a 10,000+ page site: tier pages with 16 months of data, noindex for Googlebot only, never mass-delete, and merge duplicates only on proof.
- strategyLarge Site Indexing: Page-Type Rules, Sitemap Hygiene, Mirrors and Multiple DomainsHow we manage indexing on content sites with hundreds of thousands of URLs: a page-type rulebook, four sitemap rules, canonical and 301 policy, mirror domains.